- 1404/08/12 Environmental aluminum exposure and Alzheimer’s disease risk: Evidence from a systematic review and meta-analysis
- 1404/08/12 Seasonal variation and structural influences on indoor radon exposure in residential buildings of Khuzestan Province
- 1404/08/12 Environmental modulation enhances benzene phytoremediation by Aglaonema and Dracaena in indoor settings
- 1404/08/12 An insight into the environmental and human health impacts of per- and polyfluoroalkyl substances (PFAS): exploring exposure pathways and their implicationsAA
- 1404/06/23 A policy context and process analysis to implement the Paris Agreement on climate change in the health system of Iran
- 1404/06/23 Evaluation of climate indices related to water resources in Iran over the past 3 decades
- 1404/06/23 Preparation, characterization and adsorption potential of the NH4Cl induced activated carbon for the removal of amoxicillin antibiotic from water
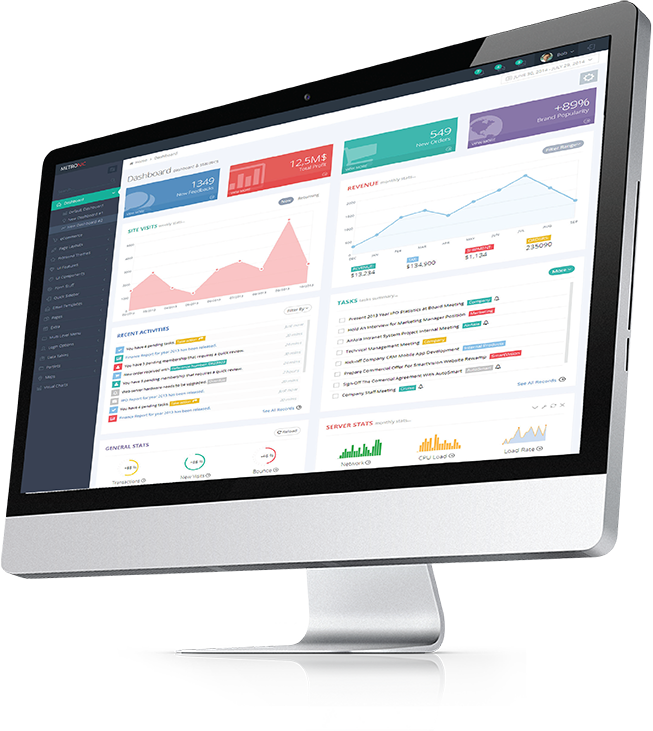
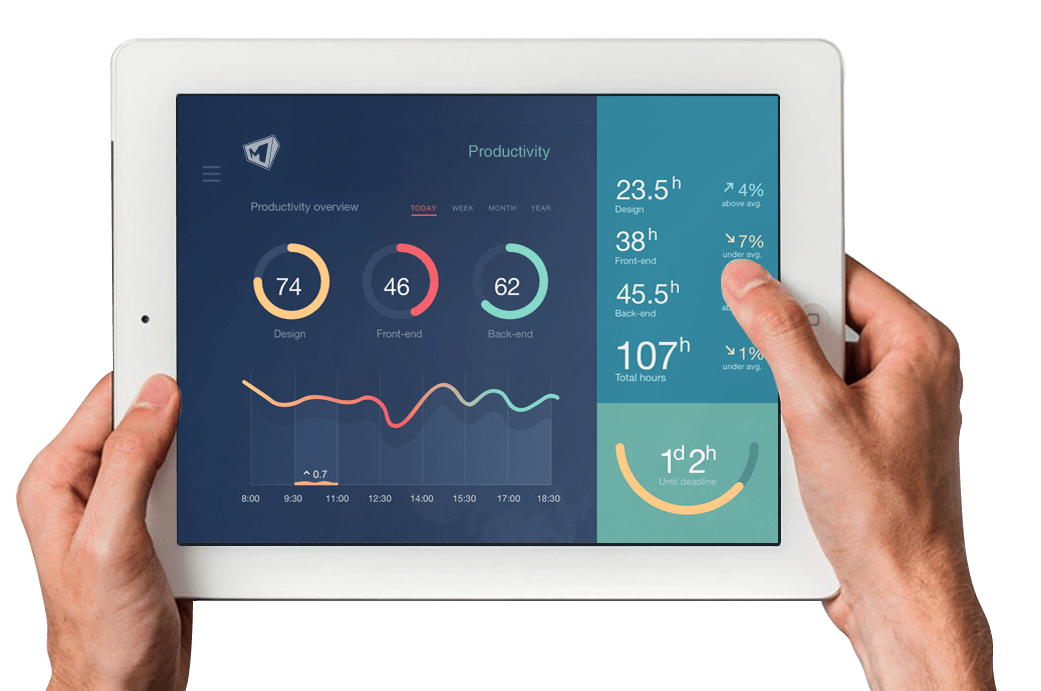
The Importance of Management Dashboards in Environmental Data Analysis
In today’s world, managing and analyzing environmental data plays a crucial role in optimizing organizational performance and reducing costs. Fields such as water, wastewater, air pollution, energy management, waste, and climate change generate vast amounts of data that cannot be effectively utilized without an appropriate system for collection, analysis, and visualization.
Management dashboards are powerful tools for presenting key data, analyzing trends, and supporting better decision-making. These dashboards help organizations and companies active in the environmental sector to:
- Reduce operational costs
- Improve efficiency
- Enhance accuracy in policy-making and planning
- Monitor performance in real time and predict future issues
Applications of Dashboards in Various Environmental Fields
-
Water Quality Management
- Water Quality Monitoring Dashboard: Displays key parameters such as pH, turbidity, residual chlorine, hardness, and electrical conductivity across distribution networks and treatment plants.
- Water Consumption and Distribution Management Dashboard: Tracks production, consumption, and leakage across different regions, and predicts potential water shortages.
- Surface and Groundwater Pollution Analysis Dashboard: Monitors nitrate, heavy metals, and microbial contaminants, and assesses the impact of human activities.
-
Wastewater Management
- Wastewater Treatment Plant Performance Dashboard: Analyzes the efficiency of treatment processes and displays key effluent parameters (BOD, COD, TSS, ammonia, and nitrate).
- Sewer Network Monitoring Dashboard: Displays flow, pressure, and blockage points in urban sewer systems to optimize operations.
- Sludge Quality Assessment Dashboard: Monitors solids content, heavy metals, and evaluates suitability for agricultural use or safe disposal.
-
Air Pollution Monitoring and Control
- Urban Air Quality Dashboard: Provides real-time display of the Air Quality Index (AQI), pollutant gas concentrations (NO₂, SO₂, O₃, CO), and particulate matter levels (PM10 and PM2.5).
- Air Pollution Episode Prediction Dashboard: Uses meteorological and pollutant data to forecast inversion events and issue alerts.
- Pollution Source Impact Dashboard: Assesses the contribution of industries, transportation, power plants, and human activities to air quality.
-
Energy Management in Water and Wastewater Facilities
- Energy Consumption Dashboard for Treatment Plants: Analyzes electricity usage, energy costs, and equipment efficiency.
- Water Distribution Pump Optimization Dashboard: Monitors pump performance, energy consumption, and recommends optimal settings.
- Renewable Energy Analysis Dashboard: Evaluates the potential use of solar, wind, or biogas energy in treatment facilities.
-
Waste Management and Recycling
- Municipal Waste Generation and Collection Dashboard: Shows the volume of waste generated, segregated, and landfilled in different areas.
- Recycling Facility Performance Dashboard: Tracks processing and recycling rates for organic waste, plastics, glass, and metals.
- Landfill Environmental Assessment Dashboard: Analyzes leachate data, greenhouse gas emissions, and the environmental impact of landfills.
-
Climate Data Monitoring and Analysis
- Temperature and Precipitation Change Dashboard: Analyzes average temperature trends, rainfall amounts, and seasonal fluctuations.
- Drought and Water Stress Dashboard: Monitors drought indicators, declining water resources, and predicts shortages.
- Extreme Heat and Frost Analysis Dashboard: Evaluates the effects of extreme temperatures on energy consumption, agriculture, and natural resources.
Why Are Management Dashboards Important?
✅ Optimize resource usage and reduce costs
✅ Monitor performance and enable faster, more accurate decision-making
✅ Improve crisis management and predict environmental risks
✅ Increase data transparency and provide managers with analytical insights
Services of the Water Quality Research Center
With several years of experience in designing and developing web-based dashboards, the Water Quality Research Center is ready to provide services in environmental data analysis, resource optimization, and data management for organizations and companies active in the environmental sector.
For consultation and the design of a customized dashboard for your organization, please contact us!

Center for Water Quality Research
Institute for Environmental Research
- Phone : 982166581703+
- Fax : 02142933261
- Postal code : 1417993363
- email: CWQR-ier@tums.ac.ir